To hire mobile app developers you have four realistic models — in-house/direct hire, freelancers, staff augmentation, and a full development agency — and the right one depends on whether the app is your long-term product or a project to ship. Rates in 2026 run roughly $55–$85/hour for juniors and $145+/hour for seniors, while a full-time US hire costs $90,000–$300,000 a year all-in. The expensive mistake isn’t the rate; it’s choosing the wrong model.

Dreambit works as both a delivery partner and an embedded team, and across 14 years we’ve shipped 150+ products with 5M+ downloads and a 4.9★ rating across 114 client reviews. Here’s how to choose a hiring model, what it really costs, which roles you need, and the red flags to screen for.

The four ways to hire mobile app developers

Each model fits a different situation:

Choosing a partner rather than a body-shop matters — see why an agency partnership is key to project success.

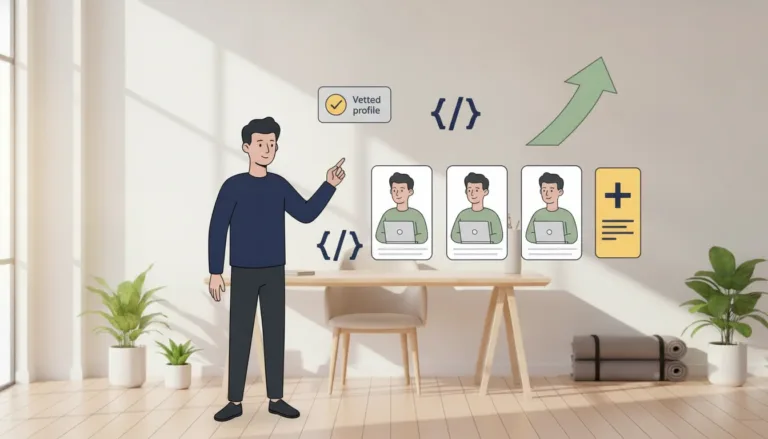
Four ways to hire app developers: in-house, freelance, staff augmentation, agency
Four hiring models and when to use each.

How much does it cost to hire mobile app developers?

Rates vary by seniority and region. In 2026, hourly rates typically run $55–$85 for juniors, ~$110 mid-level, ~$145 senior, and $225+ for leads or specialists in regulated fintech/health or heavy native work. A full development agency charges $100–$250/hour but delivers a complete team.

A $120,000/year developer really costs $165,000–$185,000 all-in once you add employer taxes and benefits (30–45%), recruitment ($7,000–$28,000), onboarding ($5,000–$10,000), and equipment. Staff augmentation avoids most of that — you pay for output, not overhead (industry benchmarks, 2026).

For the wider budget picture, see the cost of custom software development in 2026. Rate benchmarks for roles are also published by the U.S. Bureau of Labor Statistics.

The true all-in cost of a $120k developer hire versus staff augmentation
A $120k salary really costs about $182k all-in.

Staff augmentation vs in-house vs agency: when to use each

The decision comes down to ownership and time horizon:

Many companies blend them — an agency to launch, augmentation to scale, a key in-house hire to own it. This is also where CTO-as-a-service helps set the strategy.

Which roles do you actually need?

A shippable mobile product usually needs more than “a developer”:

How to vet mobile app developers — and red flags

Screen for judgment, not just syntax:

Red flags: no verifiable portfolio, quotes far below market, no QA/testing story, no questions about your users or goals, and reluctance to sign clear contracts or NDAs.

Common mistakes when hiring app developers

  1. Hiring on rate alone. The cheapest quote often costs the most by launch.
  2. Choosing the wrong model. A freelancer for a multi-year product, or a full team for a two-week task.
  3. Forgetting the all-in cost. Salary is a fraction of what a full-time hire really costs.
  4. No design or QA. Developers alone don’t make a product users keep.
  5. Skipping product ownership. Someone must own outcomes, not just close tickets.

Key Takeaways

Frequently Asked Questions

How much does it cost to hire a mobile app developer?

In 2026, hourly rates run roughly $55–$85 for juniors, ~$145 for seniors, and $225+ for leads or specialists; development agencies charge $100–$250/hour for a full team. A full-time US hire costs $90,000–$300,000 a year, and a $120k salary really costs $165,000–$185,000 all-in.

What is the difference between staff augmentation and an agency?

With staff augmentation, external engineers join your existing team and report to you — ideal for scaling capacity or filling a skill gap. An agency or dedicated team owns delivery end to end, with its own process and management. Augmentation extends your team; an agency runs the build.

Should I hire in-house or outsource mobile app development?

Hire in-house when the app is your core product and must be owned for years. Outsource — via staff augmentation or an agency — when you need to ship faster, scale flexibly, or access skills you don’t have, without the full overhead and long-term commitment of employment.

How do I vet a mobile app developer?

Ask for shipped apps with real store links (not just repositories), check how clearly they explain trade-offs, and see whether they ask about your users and goals. Red flags: no verifiable portfolio, far-below-market quotes, no QA or testing story, and reluctance to sign clear contracts or NDAs.

How many people do I need to build a mobile app?

More than one developer. A shippable product typically needs mobile engineers, a backend engineer, a UI/UX designer, a QA engineer, and someone owning product decisions. Hiring only coders — without design, QA, and product ownership — is a common reason apps launch but don’t retain users.

E-commerce app development is the process of designing, building, and maintaining mobile or web shopping applications — from single-brand retail stores to multi-vendor marketplaces and grocery delivery. What separates a profitable retail app from an expensive one isn’t the feature list; it’s conversion: how smoothly a shopper goes from browse to paid. A focused e-commerce MVP usually takes 3–5 months, and the checkout flow matters more than almost anything else you build.

Retail is one of Dreambit’s core industries, and across 14 years we’ve shipped 150+ products with 5M+ downloads. Below is the practical playbook we use with retail and D2C clients — what it costs, the features that actually convert, where AI helps, the tech stack, and the mistakes that quietly bleed revenue.

What is e-commerce app development?

E-commerce app development covers any software built to sell products or services. In practice it splits into a few product types, each with its own catalog and logistics model:

The type you choose shapes your logistics, payments, and which features earn their cost. Building a marketplace? See our definitive guide to multi-vendor marketplaces.

How much does e-commerce app development cost in 2026?

A realistic range for a custom e-commerce app in 2026 is $25,000–$300,000+, depending on scope, integrations, and platforms. A focused single-brand MVP lands at the lower end; a multi-vendor marketplace with AI personalization and live shopping sits at the top.

A single-brand e-commerce MVP with catalog, cart, secure checkout, and one payment provider typically costs $25,000–$50,000 and ships in 3–5 months — marketplaces, AR try-on, or AI personalization push a build into the $50,000–$120,000 range and beyond (Dreambit project benchmarks, 2026).

The biggest cost driver is feature complexity, followed by integrations (payments, ERP, logistics) and platform count. For the full picture, see our guide to the cost of custom software development in 2026.

E-commerce app development cost tiers in 2026 — MVP, growth and enterprise
E-commerce app build budgets by scope, 2026.

Must-have features for an e-commerce app

Conversion is the whole game. A credible retail app ships with a core built to move shoppers to checkout:

Most revenue leaks happen at checkout. We covered the fix in how to reduce cart abandonment by 20% by removing checkout steps.

Conversion & UX: where retail apps win or lose

An e-commerce app lives and dies on conversion rate. The levers that move it most:

E-commerce conversion path: browse, product, cart, checkout, paid
Fewer checkout steps means more paid orders.

AI in e-commerce apps

AI is now a baseline expectation in retail:

The right tech stack for an e-commerce app

After 60+ MVPs, our default is a cross-platform front end with a scalable commerce back end:

Our e-commerce app development process

  1. Discovery (1–2 weeks) — catalog model, logistics, success metrics.
  2. UX/UI design (2–4 weeks) — conversion-first flows and prototypes.
  3. Development (8–16 weeks) — iterative sprints, analytics instrumented.
  4. QA & launch — tested across devices and payment paths.
  5. Iterate on data — optimize the funnel that drives revenue.

Not sure an app is the right move yet? Start with our checklist on whether your business needs a mobile app.

Common e-commerce app development mistakes to avoid

  1. A heavy checkout. Every extra step and field drops conversion.
  2. Forcing account creation. Offer guest checkout; ask for the account after the sale.
  3. Slow, cluttered UI. Speed and clarity beat feature count.
  4. Ignoring retention. Push, reorder, and loyalty bring shoppers back cheaply.
  5. No analytics on the funnel. If you can’t see where shoppers drop, you can’t fix it.

Key Takeaways

Frequently Asked Questions

How much does it cost to build an e-commerce app?

Custom e-commerce app development typically costs $25,000–$300,000+ in 2026. A single-brand MVP with catalog, cart and secure checkout is usually $25,000–$50,000; marketplaces, AR, or AI personalization push it to $50,000–$120,000 and beyond. Maintenance runs about 15–20% of the build per year.

How long does e-commerce app development take?

A focused single-brand e-commerce MVP usually ships in 3–5 months. Multi-vendor marketplaces, complex logistics, AR try-on, or deep integrations add time. The fastest path is to launch a clean catalog-to-checkout experience first, then expand based on real funnel data.

What features does a successful e-commerce app need?

Conversion features above all: fast catalog and search, a frictionless guest-friendly checkout, multiple payment options, order tracking, reviews and wishlists. These move shoppers from browse to paid far more than sheer feature count — checkout quality is the single biggest lever on revenue.

How do you increase conversion and reduce cart abandonment?

Strip the checkout to the fewest steps, offer guest checkout, save details for reorder, and keep the app fast. Add trust signals, personalized merchandising, and clear returns. We instrument the funnel from day one so we can see exactly where shoppers drop and fix it.

Should I build a single-brand store or a multi-vendor marketplace?

Start with what matches your business. A single-brand D2C store is faster and cheaper to launch and validate; a marketplace adds vendors, commissions, and ratings but is more complex and costly. Many clients launch single-brand first, then expand to a marketplace once demand is proven.

Not “we use AI.” An engineering system where AI is a full participant in the process — bounded by our rules, and verified by our own controls — through Spec-Driven Development.

Why this isn’t another AI article

Every other studio today says “we do AI.” The only thing that matters is whether there’s engineering discipline behind it, or just marketing. Here’s how it actually works for us — with specifics, not slogans.

The core: Spec-Driven Development

We build through Spec-Driven Development (SDD). This isn’t a detail — it’s the reason AI gives us predictable results instead of guesswork.

The model never works from a vague “build this feature.” First comes a clear specification that becomes a contract for both the human and the AI:

  1. Spec first — we define expected behavior before any code is written
  2. Implementation within the spec — the engineer drives the AI along the contract, not the other way around
  3. Full test coverage — tests confirm conformance to the spec, not abstract coverage numbers
  4. Automatic deployment — passes the pipeline → it ships, no manual busywork
  5. AI verification of the result — a separate verification layer on top of the tests

The point: AI is never left unchecked. Spec on the way in, tests and AI review on the way out. That’s why speed never costs us quality.

Spec-Driven Development pipeline: spec, build within spec, tests, auto-deploy, AI review
Spec in; tests and AI review out — every change.

A real task, in numbers

To avoid speaking in abstractions. Take a typical feature — integrating a payment provider into a B2B product:

This isn’t “AI did everything.” AI removed the rote work, and our people reinvested that time where they’re irreplaceable.

What practice taught us (not tutorials)

The real value isn’t the tools — it’s knowing their limits. A few lessons that show we genuinely live in this:

The full set of our processes, skills, and templates is our intellectual property. But the depth at which we can talk about it is the proof that it exists.

How we keep quality and security with AI

Speaking directly to what a CTO worries about:

Tooling: the right model for the task

Our approach is pragmatic, not religious. It doesn’t matter which IDE an engineer uses — Cursor, Copilot, Figma AI, and others are all in play. What does matter: on critical work, we don’t cut corners on model quality. We match the model to the context — the strongest where the cost of error is high, and we don’t burn resources where the task is simple.

The team: a standard, not individual chaos

The result

3–5× faster at the same level of quality.

No compromise — the speed came from methodology, not cut corners. Scale, flexibility, security — proven in practice, not in theory. You get a battle-tested system, not an experiment.

Frequently Asked Questions

What is Spec-Driven Development (SDD)?

Spec-Driven Development is an approach where a clear specification is written before any code, becoming a contract for both the engineer and the AI. The model implements within the spec, tests confirm conformance, and a separate AI review verifies the result. It is how we get predictable output from AI instead of guesswork.

How does Dreambit keep AI-generated code secure?

Generated code goes through the same reviews and checks as human-written code, plus a dedicated AI pass for vulnerabilities — AI gets no bypass. Combined with the spec and tests, that gives three independent filters, so a plausible-but-wrong change does not reach production.

Does using AI reduce code quality or maintainability?

Not the way we work. Speed comes from methodology, not cut corners. Spec-driven development ties every change to a specification and tests, so any team member can maintain it — not just the original author. Coverage alone is not enough; we demand behaviour and edge-case tests.

How do you prevent AI hallucinations from reaching production?

The most dangerous output is plausible-but-incorrect code, so we never merge on “looks fine.” Spec, tests, and AI verification act as three independent filters, so a confident-but-wrong result is caught before it ships.

How much faster is development with AI at Dreambit?

On a typical feature — integrating a payment provider into a B2B product — we went from about 10 working days to roughly 2.5 at the same quality: 3–5× faster overall. The speed came from methodology, not from lowering the bar.

If you’re a wellness founder, flutter wellness app development might be the most underrated budget decision you’ll make. Building the same experience separately for iOS, Android, and web creates a structural cost leak – and it quietly drains your product budget every single sprint.

That’s not because your team is slow. It’s because of the duplication issue: building (and then maintaining) the same experience three separate times for iOS, Android, and web. This creates a structural budget leak: the same product is built, tested, and released three times. 

The Hidden Cost of “Three Teams” (iOS, Android, web)

A three-stack product organization doesn’t just triple technical work. It multiplies coordination as well.

Adding people increases coordination and communication overhead; this is the intuition behind Brooks’ Law (“adding manpower to a late software project makes it later”). And basic project-management math shows why communication gets complex fast: the number of potential communication channels grows as n(n−1)/2

Now apply that to three separate platform teams:

  • Your product spec needs three interpretations (iOS patterns, Android patterns, web patterns).
  • Your implementation needs three separate backlogs and three sets of technical tradeoffs.
  • Your QA effort becomes a three-dimensional matrix (platform × device/browser × OS version).
  • Your release becomes an orchestration problem: one store review delay or one regression can force a staggered launch, and staggered launches create user-visible inconsistencies.

While three dedicated teams can feel like “the safe choice” early on, it turns into a financial drag later: you aren’t paying just for code – you’re paying for permanent synchronization.

Where the Money Actually Goes 

Founders often picture “development cost” as mostly coding hours. In practice, TCO combines at least four cost layers:

  1. Labor is the obvious one, and it’s not just salary. Benefits and employer costs are a real multiplier. For example, the BLS release shows that wages and salaries account for ~ 70% of employer costs and benefits ~30%. 
  2. Quality engineering is the second layer. The OpenText press release on the World Quality Report reveals that 68% of organizations are either actively using GenAI or have roadmaps after pilots, and 72% report faster automation processes from GenAI integration. This means that teams are investing heavily in speeding up and scaling testing, not removing it. 
  3. Maintenance is the third layer, and it’s where “cheap launch” strategies quietly die. A benchmarking perspective from ISBSG notes that maintenance and support activities can consume a large share of total ownership cost for software applications – from 65% to 85%. 
  4. Release operations are the fourth layer: CI/CD, test automation upkeep, analytics, crash monitoring, and “fast hotfix” capability. 

The practical takeaway: when you choose three separate stacks, you don’t just buy three builds. You buy three lifecycles.

How Flutter Wellness App Development Changes Your Budget

Flutter is explicitly positioned as a way to “build apps for mobile, web, desktop, and embedded devices – all from a single codebase.” That single codebase is not a magic trick; iit’san economic lever. It changes the cost structure in three ways:

First, it attacks duplication. Instead of writing the same UI flows three times, you build core flows once and adapt where needed. Production metrics show how far this can go: the Whirlpool case study reports 92% shared codebase, a 50% reduction in development costs, and a 35% increase in development speed for the Compra Certa app effort. 

Second, it compresses time-to-feature across platforms. The BMW Group case study notes that moving away from multiple codebases “effectively solved the problem of feature disparity” and helped the team move faster while maintaining consistency across platforms. This is the kind of delta that changes not only cost, but growth strategy. 

Third, it reduces feature-parity risk (which is a quality risk). Another notable case, the Tonal story, highlights this directly: they wanted equal attention for iOS and Android with limited resources and used Flutter to maintain parity; they report releasing new versions every two weeks post-launch. 

Here’s the economic mechanism in one picture:

Two-year TCO Comparison (Flutter vs Native)

This section describes an approximate model, not a universal quote. We describe the model that assumes a “typical wellness v-one” including onboarding, profiles, subscription/payment flow, content library, basic tracking, push notifications, analytics/crash reporting hooks, and a companion web experience. However, we don’t take into consideration advanced wearables, real-time video, and heavy native-specific features.

For this model, we used BLS May 2024 median annual wages for software developers and QA/test roles, then converted to hourly costs with a benefits/overhead uplift based on BLS Employer Costs for Employee Compensation. 

We got a conservative blended “fully loaded” hourly baseline:

  • Developer ≈ $91/hour loaded (based on $133,080/year and the March 2024 wage/benefit split).
  • QA ≈ $70/hour loaded (based on $102,610/year and the same split). 

Team sizing (FTE) and schedule:

  • Build phase: six months.
  • Post-launch iteration and maintenance: eighteen months.
  • Native+web build dev FTE: 5.5 (two iOS, two Android, 1.5 web).
  • Flutter-centered build dev FTE: 3.0.
  • QA FTE reduces with a single primary codebase (still testing multiple platforms, but with less duplicated logic). This direction aligns with the industry’s focus on test automation efficiency gains and on quality engineering investment trends. 

“Shared overhead” for product design, DevOps, security, and product management is treated as $200,000 over two years, assumed equal in both scenarios (your actual number may be higher or lower; change it and recalculate). 

Hosting is assumed to be $200/month for the web front-end hosting/CDN baseline, equal for both; backend hosting is out of scope.

Comparative table

CategorySeparate native iOS + native Android + separate webFlutter-centered multi-platform
Development cost (build phase engineering only)~$480.5k~$262.1k
QA cost (build phase)~$101.0k~$67.4k
Maintenance + iteration (post-launch eighteen months; engineering + QA)~$625.3k~$312.6k
Release velocity benchmark (cross-platform feature lead time)~four weeks (higher coordination + parity risk)~two weeks (single primary implementation)
Hosting (web front-end only; two years)~$4.8k~$4.8k
Shared overhead (PM, design, DevOps, security; two years)~$200.0k~$200.0k
Total cost of ownership over two years~$1.41M~$0.85M
Delta~40% lower TCO

What Wellness Brands Gain from Flutter App Development

Wellness is a special category because your product is rarely “one and done.” You’re continuously iterating on content, retention loops, subscription conversion, and trust. That makes platform economics especially unforgiving.

For yoga studios and boutique fitness brands, the core win is speed without fragmentation. Class schedules, membership flows, video libraries, streaks, and community features change frequently – and users notice inconsistency immediately. A Flutter-centered approach makes it structurally easier for you to keep the same experience across web, iOS, and Android devices. It also enables you to deliver seamless experiences without funding three separate builds.  

Ultimately, by using Flutter, you can save a large chunk of your budget and spend more money on the things users actually feel – content quality, onboarding, personalization, stability, and support.

Start Your Flutter Wellness App Development Today

The biggest mistake wellness brands make isn’t overspending – it’s spending in the wrong places. When your budget is tied up in maintaining three parallel products, you’re not investing in what actually drives growth: better user experience, faster iteration, and stronger retention.

Flutter can change that all. What’s more important, it doesn’t just reduce development costs but also unlocks a different way of building products: faster, more consistent, and far more scalable. 

At Dreambit, we help wellness brands design and build scalable, high-performing apps using Flutter, from idea and architecture to launch and growth. We don’t just write code; we help you eliminate hidden costs, speed up delivery, and create products users actually stick with.

👉 Let’s talk about your product and where you might be losing budget today.

Data-driven wellness helps wellness studio owners see revenue leaks before they become end-of-month problems. Instead of relying on delayed reports, studios can track bookings, cancellations, memberships, and client behavior in real time, turning daily operations into measurable growth.

Data-driven wellness changes the game. When every visit, cancellation, and membership purchase shows up live in your admin panel, your studio stops being a guessing game and starts working like a system.

The Hidden Cost of End-of-Month Reports

Relying on backward-looking reports is like diagnosing a fever long after the fever has broken. By the time you see the numbers, the opportunity to change behavior, re-engage a client, or fix a process has already passed. 

In a typical fitness or wellness chain, revenue leaks are invisible until it’s too late:

  • You notice a drop in revenue only when the monthly income statement lands in your inbox.
  • You see churn in numbers, not in faces – you know “20 clients left,” but not who they are or when they started disappearing.
  • Administrators operate blindly: they answer calls and messages but don’t see risk signals.

What’s even worse, if your analytics are delayed, you’re making next month’s decisions based on last month’s problems.

Solution: Real-Time Data at Every Step

To close these gaps, wellness businesses need a live data system that instantly updates the admin panel with every booking, class signup, cancellation, or membership sale. For example, as soon as a client signs up or skips a class, dashboards and reports show this in real time. At Dreambit, we build modern fitness software that unifies billing, scheduling, and CRM into one ecosystem, so owners see all key metrics side by side. This means no more batch updates or manual spreadsheet imports – the admin interface continuously reflects the current status. 

Key elements of a real-time management system include:

  • Live booking updates: New registrations, cancellations, and purchases immediately update membership and revenue figures.
  • Centralized dashboard: Revenue, attendance, and retention metrics display in real time across all locations. This turns your admin panel into a unified dashboard for operations and finances.
  • Automated alerts: The system flags warning signs, like repeated no-shows or payment delays, so managers can intervene before small issues turn into churn.

With these features, the admin panel becomes a living dashboard, enabling you to react immediately. Classes and schedules can be adjusted instantly based on live attendance, and billing problems (like overdue payments) pop up immediately instead of hiding until the month’s end. 

Case study: Discover how our QazFit app already uses “real-time statistics”.

Two Core Metrics to Pay Attention to: LTV and Churn

Two metrics can be particularly informative for wellness studio owners: customer lifetime value (LTV) and churn rate. 

LTV (lifetime value) answers: “How much money does one client bring over the entire relationship?”. When your system tracks every transaction per client, it can approximate LTV on the fly – by membership type, coach, location, or channel of acquisition.​ Churn rate answers: “How many clients are quietly leaving, and how fast?”
If your platform tracks class cancellations and long gaps between visits, churn stops being an abstract monthly percentage and becomes a list of people at risk right now.

For instance, if your average monthly revenue per member (ARPU) is $96 and your churn rate is 4%, each customer’s LTV is about $2,400 (since LTV = ARPU ÷ Churn Rate). By tracking these numbers live, you know exactly how much revenue each customer segment is worth

How to Leverage That Data

Data-driven wellness isn’t about pretty charts. It’s about clear, opinionated alerts that tell your staff what to do next.

A good admin interface can:

  • Flag risk patterns, not just show numbers. For instance: “Anna hasn’t shown up to the last 3 yoga classes she booked.”
  • Turn conditions into triggers.
    Example rules:
    • If a new client misses their third scheduled visit → mark as “high churn risk” and show on the receptionist’s screen.
    • If someone’s pass expires in 5 days and they’ve visited more than 8 times → send a targeted upsell offer.
  • Connect insights to actions. A single click from the risk list should let your staff call, message, or send a promo to specific clients. And that’s directly from the admin panel.

How Dreambit Builds Admin Panels that Think

Dreambit focuses on cross‑platform apps and admin systems where real‑time data, UX, and business logic are tightly integrated.

For wellness and healthcare businesses, that means:

  • Unified data pipelines.
    Every booking, payment, cancellation, and reschedule is captured as a structured event, instead of being “just a row in a spreadsheet.”
  • Interfaces that surface money leaks.
    Dashboards don’t just visualize “how many clients you have.” They highlight no‑show patterns, expensive time slots with low utilization, and membership types with weak retention.
  • Role-specific views.
    Owners see LTV, churn, and location performance. Admins see today’s risk list, overdue balances, and clients to follow up. Coaches see their own funnel: trial users, active clients, and those drifting away.

How This Looks in Practice

Imagine a regular Tuesday in your wellness chain with a modern, data‑driven backend:

9:15 AM – Attendance spike
Your dashboard shows that morning pilates sessions are consistently over 90% full, while late evenings stay under 40%. Instead of guessing, you start shifting staff and adding morning slots where demand is proven.
11:30 AM – At‑risk clients 
The system highlights 27 clients who haven’t attended their last 3 booked classes. The admin doesn’t have to hunt for them in reports – they’re in a single “At Risk” view with suggested actions (call, WhatsApp template, promo code).
3:00 PM – Real-time promotion results
You launch a “Bring a friend this week” campaign. The panel shows, in real time, how many referral codes are used, which branches react fastest, and which coaches generate the most referrals from their clients.
6:45 PM – Dynamic pricing or waitlists
As one location reaches full capacity, the admin sees it live and can enable a waitlist or suggest nearby branches with free spots.

Conclusion: make data-driven wellness a mindset, not a dashboard

Ultimately, “data-driven wellness” isn’t about buying another analytics tool.
It’s about designing your product so that every important action is captured, every pattern is visible, and every insight is tied to a concrete next step.

Don’t wait until the month-end reports reveal losses. By partnering with Dreambit, you can start developing a custom real-time analytics solution for your wellness business today.
Contact us!