Kseniia Sevostianova
MVP development is the process of building the smallest version of a product that can test your core business bet with real users — not a stripped-down app, but a focused one. Done right, a custom MVP costs roughly $30,000–$120,000 and ships in 3–6 months, and its job is to produce evidence, not features. The hardest part isn’t building it; it’s deciding what to leave out.
Dreambit has shipped 150+ products over 14 years, including 60+ MVPs, with 5M+ downloads. Below is the practical playbook we use with founders — what an MVP really is, what it costs, how long it takes, how to scope it so it proves the right thing, and how AI now compresses the timeline.
What is an MVP — and what MVP development really means
An MVP (minimum viable product) is the smallest thing you can build to learn whether your core assumption is true. MVP development is therefore an exercise in prioritization: define the one flow that tests the bet, build it well, ship it, and measure. It is not “cheap version 1” — a broken experience teaches you nothing except that people dislike broken experiences.
We unpack this mindset in applying product thinking to client projects.
How much does MVP development cost in 2026?
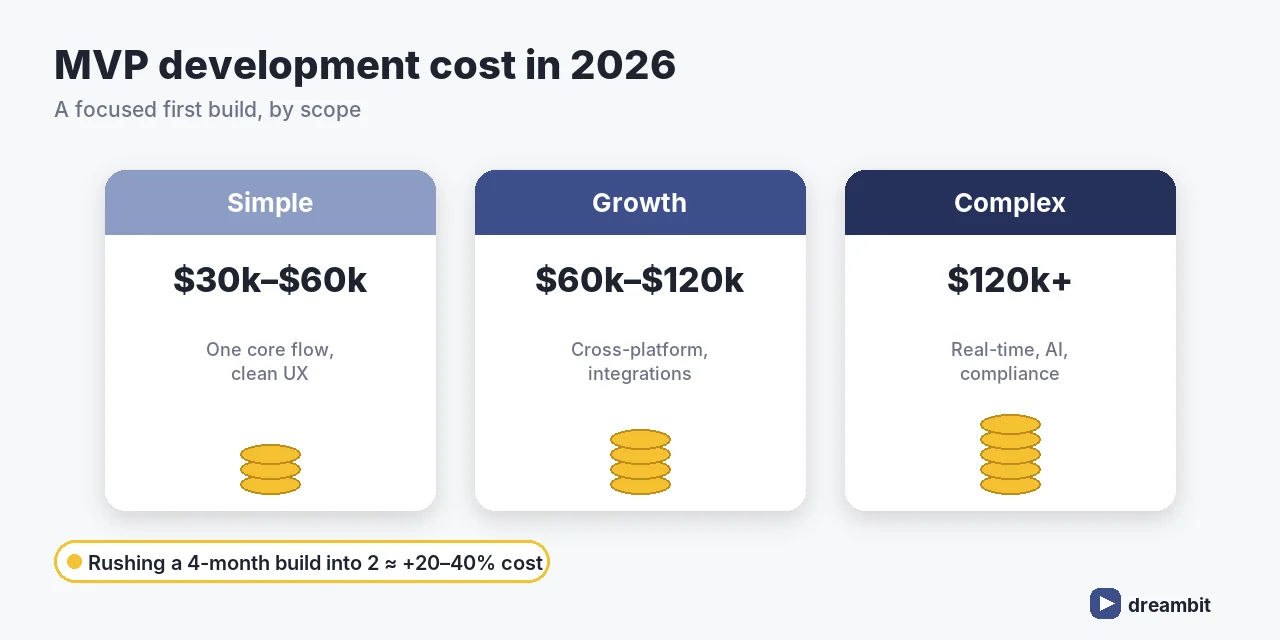
A realistic range for a custom MVP in 2026 is $30,000–$120,000+, depending on scope, platforms, and integrations. A single-platform MVP with one core flow lands at the lower end; a cross-platform product with real-time features, AI, or compliance sits higher. No-code MVPs are cheaper ($5,000–$15,000) but hit scaling limits fast.
A custom MVP with one core flow, clean UX, and the integrations it truly needs typically costs $30,000–$60,000 and ships in 3–4 months. Trying to compress a 4-month build into 2 usually raises the budget 20–40% and the defect rate with it (Dreambit project benchmarks, 2026).
For the full breakdown of what drives software budgets, see the cost of custom software development in 2026.
How long does MVP development take?
A realistic timeline is 3–6 months. A simple, single-platform app with limited backend can ship in 6–8 weeks; a cross-platform product with real-time data, AI, or compliance runs 4–8 months. The variable isn’t coding speed — it’s scope. The tighter the scope, the faster you learn.
How to scope an MVP right
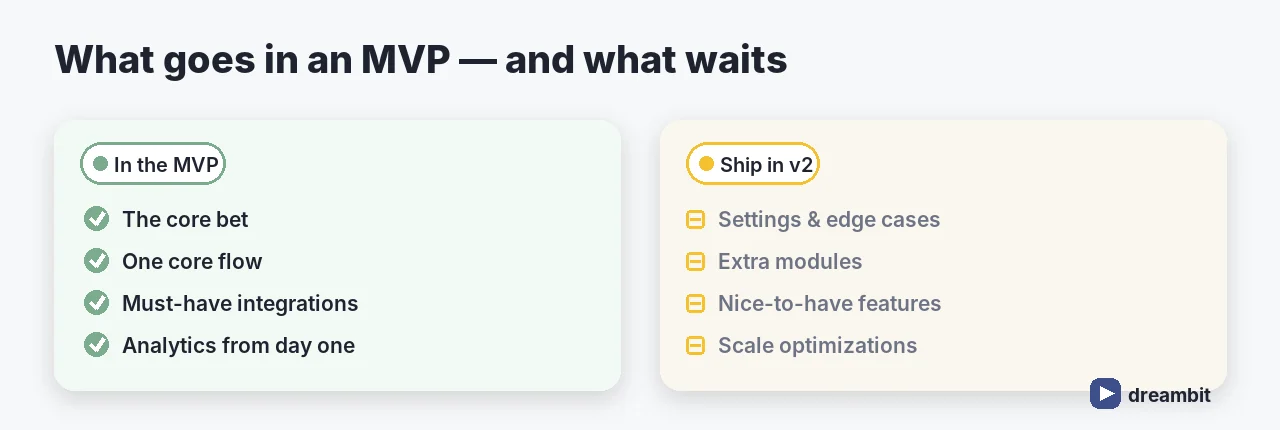
This is where MVP development is won or lost. Our rule: tie every feature to the one hypothesis you’re testing, and cut the rest to a later release.
- Define the core bet — the single thing that must be true for the product to work.
- Pick one core flow — the path that tests that bet end to end.
- Cut “nice to have” to v2 — settings, edge cases, and extra modules can wait.
- Instrument from day one — if you can’t measure it, you can’t learn from it.
Planning a startup build? Start with what future clients need to know before launching.
How AI speeds up MVP development
Used with discipline, AI compresses MVP timelines by roughly 40–60% — the boring parts (boilerplate, first-draft code, tests, docs) get faster, while engineers keep the judgment. But speed without control is dangerous, which is why we build spec-first with tests and verification. See how Dreambit builds with AI.
Our MVP development process
- Discovery (1–2 weeks) — the bet, the core flow, success metrics.
- UX/UI design (2–3 weeks) — prototype the one flow, test it.
- Development (6–14 weeks) — build spec-first, instrumented, tested.
- Launch & measure — ship to real users, watch the metric.
- Iterate — double down on what worked, cut what didn’t.
Curious what the first sprint looks like? Here’s what we do in the first two weeks.
Common MVP development mistakes to avoid
- Building too much. The most common and most expensive mistake — an MVP with 40 features tests nothing.
- Shipping a broken core. Small scope, high quality — not the reverse.
- No metric. If you don’t define what success looks like, you can’t tell if you found it.
- Skipping discovery. A week of it saves months of building the wrong thing.
- Rushing the timeline. Crushing 4 months into 2 inflates cost and defects.
Key Takeaways
- MVP development in 2026 typically costs $30,000–$120,000+ and ships in 3–6 months.
- An MVP is a hypothesis test, not a cheap v1 — scope to one core flow, built well.
- Cut “nice to have” to v2 and instrument the product from day one.
- AI, used with discipline, compresses timelines 40–60% without lowering the bar.
- Rushing scope raises cost and defects — tight scope is the real accelerator.
Frequently Asked Questions
Custom MVP development typically costs $30,000–$120,000+ in 2026. A single-platform MVP with one core flow is usually $30,000–$60,000; cross-platform products with real-time features, AI, or compliance run higher. No-code MVPs are cheaper ($5,000–$15,000) but hit scaling limits fast.
A realistic MVP timeline is 3–6 months. A simple single-platform app can ship in 6–8 weeks; complex platforms with real-time data, AI, or compliance take 4–8 months. Scope, not coding speed, is the main driver — the tighter the scope, the faster you learn.
Only what tests your core bet: one core user flow built to a high standard, the integrations it genuinely needs, and analytics from day one. Settings, edge cases, extra modules, and nice-to-have features belong in v2. An MVP with 40 features tests nothing.
A prototype demonstrates an idea (often clickable, not production-ready); an MVP is a real, shippable product that real users can use to validate a business bet. The MVP produces evidence from actual usage, which a prototype can’t.
Yes — used with discipline, AI compresses MVP timelines by roughly 40–60% by handling boilerplate, first-draft code, tests, and docs, while engineers keep the judgment. We build spec-first with tests and verification so speed never comes at the cost of quality.
Applying product thinking to client projects means treating outsourced work not as a list of features to ship, but as a product with users, outcomes, and a business to grow. The difference between outsourcing and product development is not who writes the code — it is whether the team optimises for output (tickets closed) or outcomes (problems solved, metrics moved). The best agencies erase that line: they bring a product mindset to every client engagement.
At Dreambit we sit on both sides of this. We have delivered 150+ products for clients over 14 years, and we build our own products too — which forces us to think like owners, not order-takers. Here is how product thinking changes client work, why it matters, and how to apply it without blowing up scope or budget.
Outsourcing vs. product development: what’s the real difference?
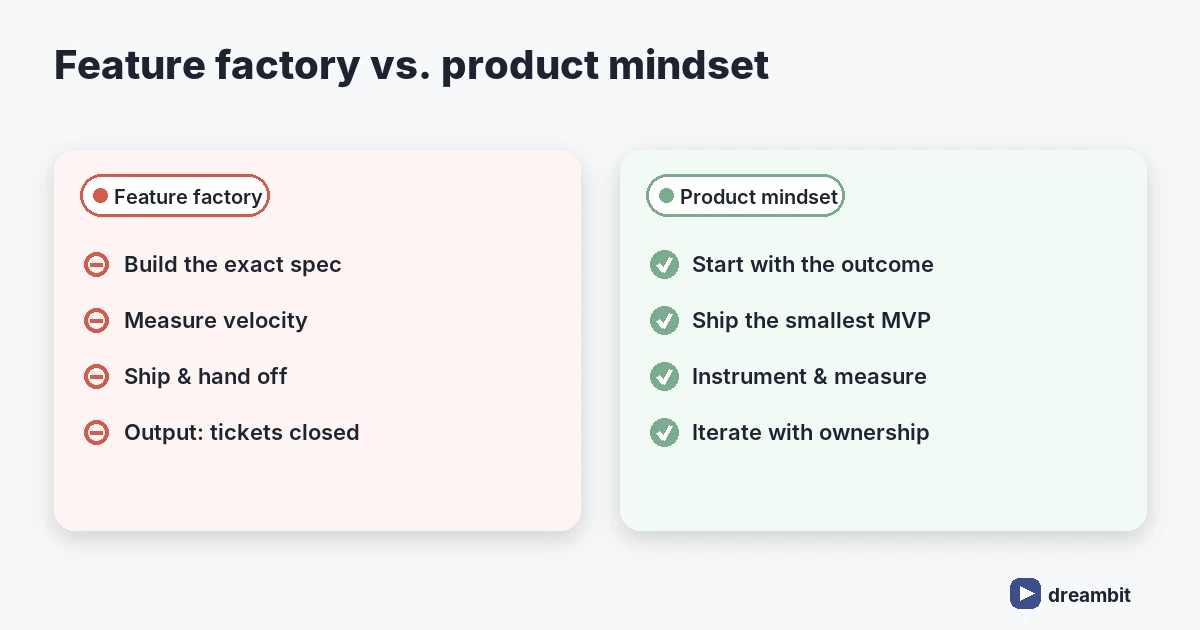
Classic outsourcing is a “feature factory”: the client hands over a spec, the vendor builds exactly that, and success is measured by on-time delivery. Product development asks a different question first — what outcome are we trying to create, and how will we know it worked? The deliverable might be the same app, but the decisions along the way are different.
- Feature factory: build what’s on the ticket → measure velocity → ship.
- Product mindset: understand the user and the metric → build the smallest thing that moves it → measure → iterate.
Neither is “wrong,” but only one compounds value. We wrote more about this partnership dynamic in why an agency partnership is key to project success.
Why product thinking matters for client projects
Because clients rarely want software — they want a result. A booking app exists to fill calendars; a fintech app exists to move money safely and retain users. When an agency optimises only for “did we build the spec,” it can deliver a technically perfect product that fails commercially.
Teams that measure outcomes over output ship fewer features but create more value — in our experience, the highest-performing client projects cut their initial feature list by 30–50% and reinvested that time into the few flows that actually drove activation (Dreambit delivery data, 2026).
How to apply product thinking to client projects
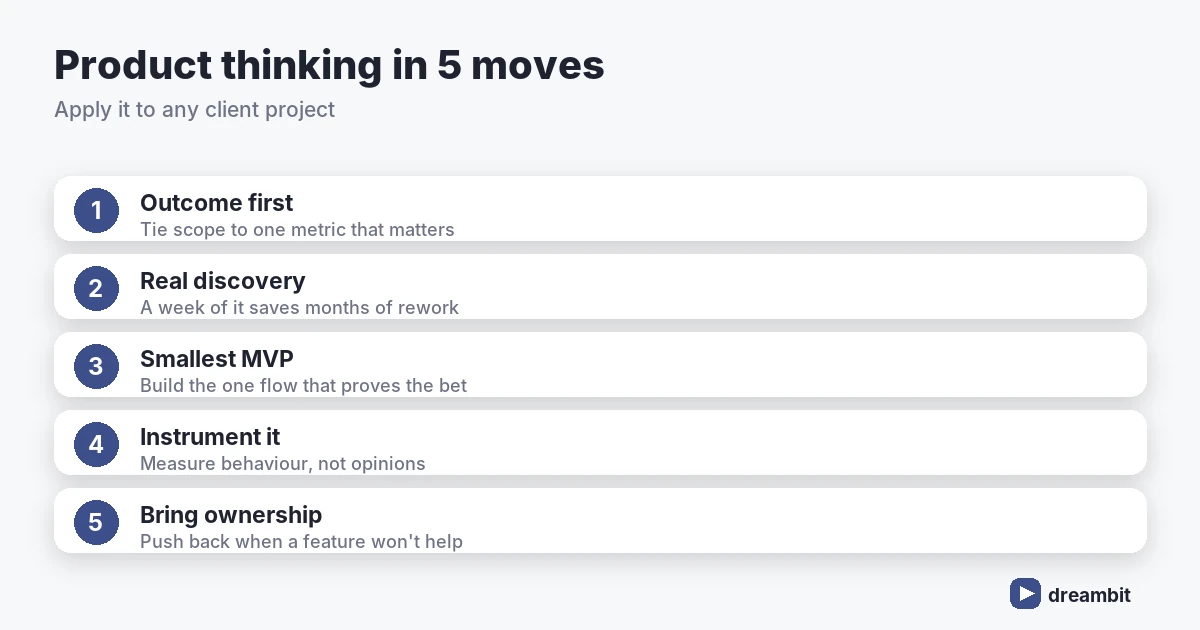
You do not need to become the client’s product manager to think like one. Five practical moves carry most of the value:
1. Start with the outcome, not the feature list
Before estimating, ask what metric this project is meant to move — activation, retention, revenue, cost saved. Tie scope to that metric.
2. Run real discovery
A week of discovery — users, constraints, success criteria — saves months of building the wrong thing. See what we actually do in the first two weeks of a project.
3. Ship the smallest version that proves value
An MVP is a hypothesis, not a downsized product. Build the one flow that tests the core bet. Our lessons from 60+ Flutter/Firebase MVPs go deeper here.
4. Instrument and measure
If you cannot see what users do, you are guessing. Analytics and clear success metrics turn opinions into decisions.
5. Bring ownership, not just hours
Push back when a requested feature won’t serve the outcome. Clients hire experts for judgement, not just hands — that is the heart of CTO-as-a-service thinking.
What our partner sees from their side
We explored this same question with our partners at SDA, who put it sharply in their companion piece on product thinking in outsourcing:
“Sometimes the most valuable contribution a team can make isn’t what it built, but what it helped the client decide not to build at all.”
— SDA, on product thinking in outsourced projects
It is a view we share completely: product thinking is not a methodology you import once, it is a habit both partners practise on every engagement — challenging the backlog, protecting the budget, and building only what moves the outcome.
Common pitfalls when applying product thinking
- Discovery theatre. Running a workshop and then ignoring it. Let findings change scope.
- Gold-plating the MVP. Adding “just one more” feature until the hypothesis is buried.
- No metric ownership. If no one watches the numbers after launch, product thinking stops at launch.
- Treating the client as the enemy of scope. Product thinking is collaborative, not a fight over the contract.
Key Takeaways
- Outsourcing vs. product development is a mindset difference: output vs. outcomes.
- Apply product thinking by starting with the metric, running real discovery, shipping a true MVP, instrumenting it, and bringing ownership.
- The best agencies build client work like their own product — Dreambit does both, across 150+ launches.
- Product thinking is a shared habit between partners, practised every engagement.
Frequently Asked Questions
What is product thinking in the context of client projects?
Product thinking means treating a client engagement like a product: focusing on the user, the outcome, and the business metric rather than just delivering a fixed feature list. It shifts success from “we shipped the spec” to “we moved the result the client actually cares about,” which usually means fewer features built better.
Is outsourcing worse than in-house product development?
Not inherently. Outsourcing becomes a problem only when the vendor acts as a feature factory with no stake in outcomes. An agency that applies product thinking — discovery, metrics, MVP, ownership — can match or beat in-house teams, while bringing wider cross-project experience.
How do you apply product thinking without expanding scope?
By tying scope to a single outcome metric and cutting anything that doesn’t serve it. Product thinking often shrinks scope: you build the smallest flow that proves the core bet, measure it, and only then invest in more. That keeps budgets focused rather than inflated.
Why is Dreambit qualified to talk about this?
Because Dreambit is both an agency and a product builder. Over 14 years we have delivered 150+ products for clients and shipped our own, earning a 4.9★ average rating across 114 reviews. Building our own products forces us to bring an owner’s mindset to every client engagement.
Frequently Asked Questions
Product thinking means treating a client engagement like a product — focusing on the user, the outcome, and the business metric rather than a fixed feature list. Success shifts from “we shipped the spec” to “we moved the result the client cares about,” which usually means building fewer features, better.
Traditional outsourcing builds exactly what the spec says and measures velocity. Product thinking starts with the outcome and the metric, then builds the smallest thing that moves it and iterates. The deliverable may look the same, but only the second approach compounds real business value.
Usually the opposite. Product thinking ties scope to one outcome and cuts what does not serve it, so budgets focus on the few flows that matter. Teams often ship a leaner MVP two to three months sooner, then invest based on real usage rather than guesses.
Yes. The most effective partners combine development with business analysis, discovery, and a metrics-driven mindset. Dreambit does both — we build clients’ products and our own, across 150+ launches — which forces an owner’s mindset onto every engagement.
Tie scope to a single outcome metric and cut anything that does not serve it. Run real discovery, ship the smallest MVP that proves the core bet, instrument it, and only then expand. Product thinking usually shrinks scope rather than inflating it.
Build with a product-minded partner
Outsourcing and product development don’t have to be opposites. The agencies worth hiring apply product thinking to every client project — starting with outcomes, shipping lean, and owning the result. Book a free consultation and let’s apply product thinking to yours.
Healthcare app development is the process of designing, building, and maintaining secure mobile or web applications for medical and wellness use — telemedicine, electronic health records, remote patient monitoring, and patient engagement. The defining constraint is compliance: a healthcare app must protect sensitive patient data under HIPAA, GDPR, and (where applicable) FDA rules before it ships a single feature. For most products a compliant MVP takes roughly 5–8 months, and the security and interoperability decisions made on day one shape everything that follows.
At Dreambit, healthcare is one of our core industries, and across 14 years we have shipped 150+ products with 5M+ downloads and a 4.9★ average rating. Below is the practical playbook we use with clinics, startups, and health systems — what it costs, which regulations actually apply, how interoperability works, and the mistakes that quietly sink medical products.
What is healthcare app development?
Healthcare app development covers any software that stores, transmits, or acts on health data. In practice it falls into a few product categories, each with its own compliance and clinical expectations:
- Telemedicine & virtual care — video visits, e-prescriptions, scheduling.
- EHR/EMR systems — clinical records, charting, provider workflows.
- Remote patient monitoring (RPM) — wearables, vitals tracking, alerts.
- mHealth & wellness — fitness, mental health, chronic-condition management.
- Patient engagement — portals, appointment booking, medication reminders.
- Pharmacy & medication — ordering, adherence, interaction checks.
The category you choose determines your regulatory load and your integrations far more than your feature wishlist does.
How much does healthcare app development cost in 2026?
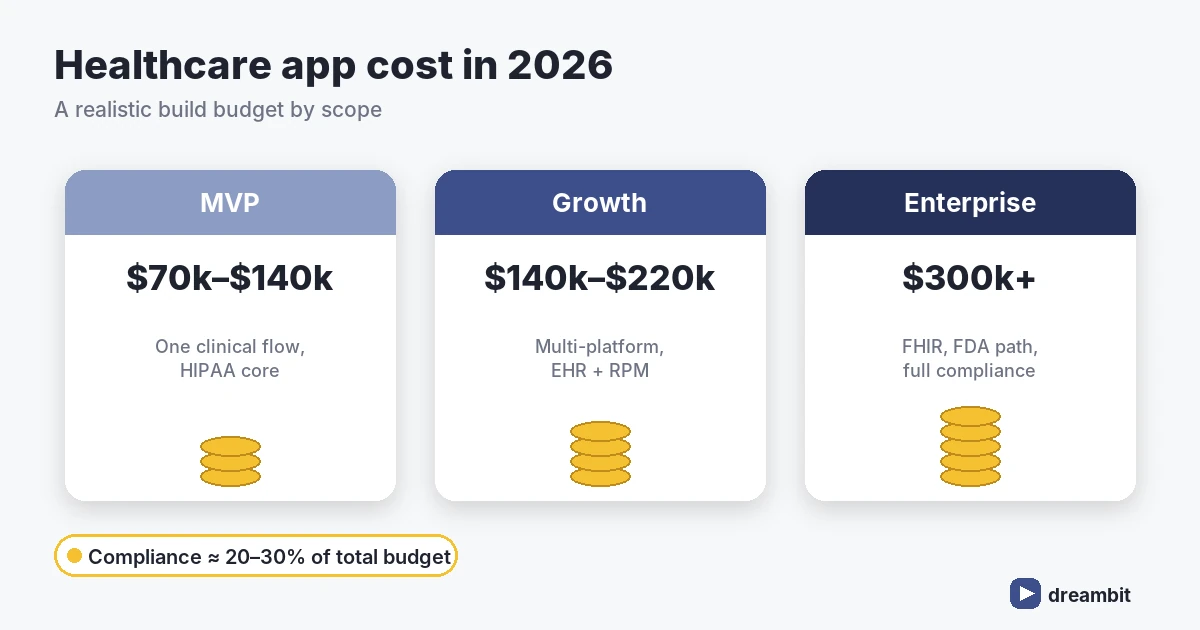
A realistic range for a custom healthcare app in 2026 is $70,000–$300,000+, depending on scope, compliance, and clinical integrations. A focused, single-platform MVP with one core flow lands at the lower end; a multi-platform product with EHR integration, RPM, and full HIPAA controls sits at the top.
A HIPAA-compliant healthcare MVP with secure authentication, encrypted records, and one core flow (such as telemedicine visits) typically costs $70,000–$140,000 and reaches the app stores in 5–8 months — compliance and security work alone account for 20–30% of that budget (Dreambit project benchmarks, 2026).
The main cost drivers are predictable: HIPAA-grade security and audits, EHR/FHIR integrations, the number of platforms, and the seniority of a team that has shipped regulated medical products before. For a deeper breakdown, see our guide on the cost of custom software development in 2026.
Which regulations and compliance standards apply?
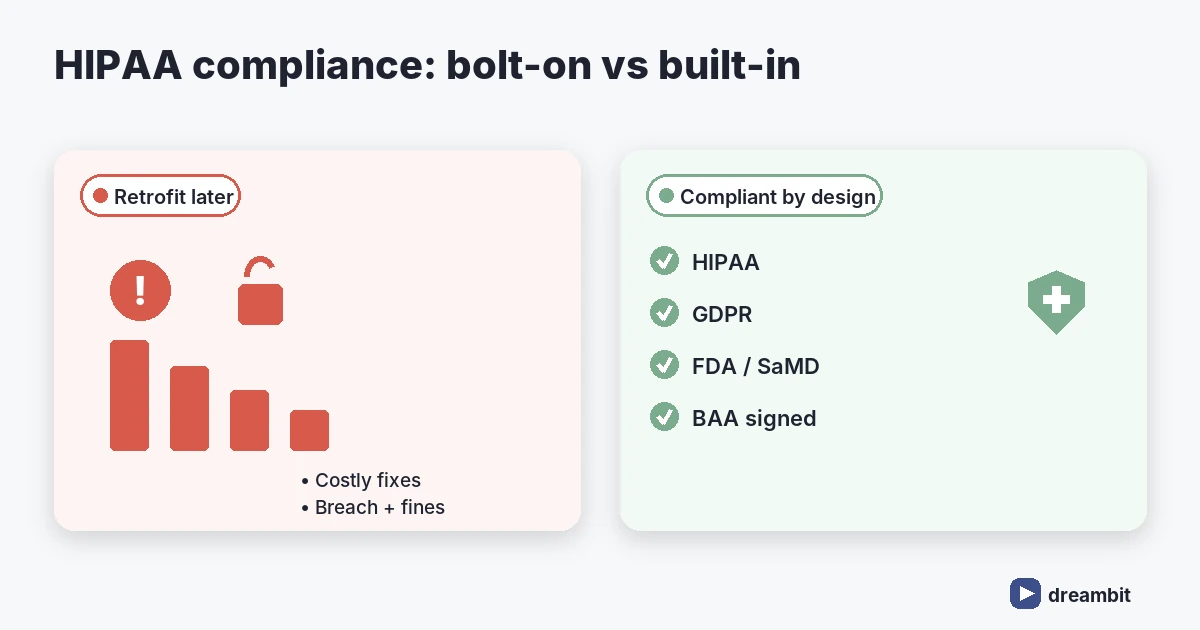
Compliance is not a feature you bolt on later — it shapes your data model, your hosting, and your vendor contracts. The standards that most often apply to healthcare app development are:
- HIPAA (US) — privacy and security of protected health information (PHI); requires encryption, access controls, audit logs, and signed BAAs with every vendor.
- GDPR (EU) — consent, data minimisation, and the right to erasure for personal health data.
- FDA (US) — applies when an app qualifies as Software as a Medical Device (SaMD).
- HITECH — breach notification and stricter enforcement of HIPAA.
- SOC 2 — increasingly expected by hospitals and enterprise partners.
The practical rule we give every client: confirm which regulations apply before design starts. A Business Associate Agreement (BAA) must be in place with every cloud and third-party service that touches PHI — including your hosting provider.
Interoperability: HL7, FHIR and EHR integration
A healthcare app rarely lives alone. To be useful it must exchange data with hospital and clinic systems, and that means standards-based interoperability. HL7 FHIR is the modern standard for exchanging health records via APIs, and most major EHRs (Epic, Cerner/Oracle Health) expose FHIR endpoints. Building on FHIR from the start avoids brittle custom integrations and makes your product far easier to adopt inside a health system.
Must-have features for a healthcare app
Whatever the category, a credible healthcare app ships with a non-negotiable core:
- Secure onboarding with MFA and role-based access control
- End-to-end encryption of PHI at rest and in transit
- Audit logging of every record access
- Appointment booking and reminders
- Secure messaging between patient and provider
- Accessibility (WCAG) — healthcare audiences are broad and often impaired
AI now sits alongside that baseline too — symptom triage, documentation assistants, and adherence prediction. We covered the retention side of this in how we predict user churn and bring users back.
The right tech stack for a healthcare app
There is no universally best stack, but there is a sensible default. After 60+ MVPs we lean toward a cross-platform front end with a strongly-typed, auditable back end.
- Frontend: Flutter or React Native — one codebase for iOS and Android, cutting build cost by 30–40%. See why we use Flutter and Firebase for MVPs.
- Backend: Node.js or Python (Django) for maintainable, testable services.
- Data: PostgreSQL, encrypted at rest; PHI segregated and access-logged.
- Cloud: AWS or Google Cloud under a signed BAA, with region controls for data residency.
Our healthcare app development process
We run regulated builds in five stages, with compliance and security threaded through each:
- Discovery (1–2 weeks) — scope, regulations, and architecture.
- UX/UI design (2–4 weeks) — clinical flows, prototypes, accessibility.
- Development (10–18 weeks) — iterative sprints with security reviews.
- QA & security testing — including penetration testing before launch.
- Launch & maintenance — monitoring, updates, and compliance upkeep.
Curious what the opening weeks look like? Here is what we actually do in the first two weeks of a project.
Common healthcare app development mistakes to avoid
- Treating HIPAA as a phase. It is an architecture constraint — bake it in from discovery.
- Skipping BAAs. Every vendor touching PHI needs a signed agreement; your cloud included.
- Ignoring interoperability. Without FHIR, hospital adoption stalls.
- Over-building the MVP. Ship one clinical flow brilliantly before adding modules.
- Skipping penetration testing. In health, a single breach can end the product and trigger fines.
Key Takeaways
- Custom healthcare app development in 2026 typically costs $70,000–$300,000+, with compliance taking 20–30% of the budget.
- Confirm HIPAA, GDPR, and FDA/SaMD scope before design begins, and sign BAAs with every PHI vendor.
- Build on HL7 FHIR for EHR interoperability from day one.
- Security — encryption, MFA, audit logs, penetration testing — is the baseline, not a bonus.
- Ship a focused, compliant MVP in 5–8 months, then expand on real usage.
Frequently Asked Questions
A focused, HIPAA-compliant healthcare MVP usually takes 5–8 months from discovery to app-store launch. The variable is compliance and integration: products needing EHR/FHIR connectivity, remote patient monitoring, or FDA clearance sit at the longer end, while a single-flow patient-engagement app can launch faster.
Most custom healthcare apps cost between $70,000 and $300,000+ in 2026. A lean single-platform MVP starts around $70,000–$140,000, while multi-platform products with EHR integration, RPM, and full HIPAA controls run higher. Compliance and security typically account for 20–30% of the total.
HIPAA compliance requires encryption of PHI at rest and in transit, strict access controls with audit logging, secure authentication, breach-notification processes, and signed Business Associate Agreements with every vendor that handles PHI — including your cloud host. It is an architectural commitment, not a checkbox added before launch.
FHIR (Fast Healthcare Interoperability Resources) is the modern HL7 standard for exchanging health data through APIs. It matters because most major EHRs expose FHIR endpoints, so building on it lets your app share records with hospital systems reliably — which is often the difference between adoption and rejection inside a health system.
Yes, provided the agency has shipped regulated products and treats security as a first-class concern. Look for HIPAA experience, a documented security-testing process, willingness to sign a BAA, and verifiable results. Dreambit has delivered 150+ apps with a 4.9★ average rating across 114 client reviews.
Build your healthcare app with Dreambit
Healthcare app development rewards teams that understand regulation, security, and clinical workflows in equal measure. With 14 years of delivery experience, 150+ launched products, and an AI-first approach, Dreambit helps founders, clinics, and CTOs ship compliant medical products that pass audits and earn patient trust. Book a free consultation and let us scope your healthcare app together.
App icon A/B testing is one of the fastest ways to increase organic installs without rebuilding onboarding or spending more on paid traffic. It’s the first thing users see in the app store and a major factor in whether they click through or scroll past. Yet too often, teams choose an icon based on personal taste or branding alone, treating it as “just a logo.” In reality, the app icon is one of the strongest conversion levers. A compelling icon can grab attention in crowded search results and convince more users to check out your app.
Recently, our team used ChatGPT to generate new icon concepts and ran a simple A/B test in the stores. The result? We doubled our weekly organic installs (+100%) in just one week. In this article, we’ll share how we achieved this explosive improvement.
After generating concepts, we validated them with app icon A/B testing in both stores to measure real install conversion uplift.
The Experiment: New Icons via AI and A/B Testing
To boost our app’s install conversion, we ran a structured experiment in three steps, focusing on the app icon:
| Modern app stores (Google Play and Apple’s App Store) allow developers to run A/B tests on visual assets to see which version attracts more users. The app icon is highlighted above as one of the most impactful elements to test. By testing one element at a time (an icon in our case) and running the experiment for at least 7 days, you can get clear, reliable results. |
Step 1. Generate 10 new icon concepts with AI (GPT-5).
Instead of starting in Figma, we started in GPT‑5.
The goal was not to achieve pixel‑perfect design. The goal was to explore the widest possible range of visual directions that could resonate with our audience — without burning design time.
What GPT‑5 helped with:
- Turning our positioning and audience into clear visual directions.
- Translating generic ideas (“modern”, “trustworthy”) into concrete shapes, colors and metaphors.
- Producing 10 distinct icon concepts instead of 2–3 safe variations.
A simplified version of the prompt we used:
“You are a senior mobile app brand designer.
Our app: [short description, category, main value].
Target users: [who they are, what they care about].
Competitors: [2–3 names].
Task: Propose 10 distinct app icon concepts that would stand out in the App Store/Google Play search results for [key search terms].
For each concept, describe:
– Color palette
– Main shape/symbol
– Style (flat/3D/gradient/minimalist, etc.)
– Emotional message (e.g., ‘security’, ‘speed’, ‘fun’)
– Why it would convert.”
From there, we shortlisted the 5–10 most promising ideas tand turned them into production‑ready icon variants.
The key here was quantity and diversity: by generating many different styles, we increased our chances of discovering a high-performing design that we wouldn’t have thought of on our own.
Step 2. Run an A/B test in the App Store/Google Play
Next, we put these AI-generated icons to the test with real users. Both major platforms offer native A/B testing tools for app listings:
- Google Play: Store Listing Experiments
- App Store: Product Page Optimization / Custom Product Pages
We set up an experiment to compare our current icon against several of the new AI-derived icons. Each user who discovered our app in the store would randomly see one of the icon variants. Crucially, we only tested one element at a time – the icon – while keeping everything else (screenshots, description, etc.) the same, to ensure that any difference in install rates would be due to the icon alone. We also followed best practices by letting the test run for a full week to capture weekday vs. weekend user behavior.
During the experiment, we closely monitored the conversion rate (the percentage of store visitors who clicked “Install”) for each icon version. Rather than guess which icon looked “best,” we let users vote with their clicks.
In fact, ASO experts often recommend generating multiple creative variants and then using A/B testing to see which variant drives the highest conversion – and that’s exactly what we did.
Step 3: Pick the Winner and Roll It Out
After seven days, the A/B test had gathered enough data to declare a clear winner. One of the GPT-5 generated icon concepts significantly outperformed the original icon (and the other variants) in conversion rate. Once we identified this winning icon, we swiftly updated our app listing to use it as the official icon for all users.
Afterwards, we still monitored post‑launch metrics for a few days to confirm the uplift holds:
- Organic impressions → installs
- Overall install volume
- Any changes in uninstall rate.
This metric gave us statistical confidence that this variant wasn’t just randomly better, but truly more appealing to users.
The winner from our app icon A/B testing became the new default icon, and organic installs doubled within a week.
Results: +100% Conversion to Install
The impact of the new icon was dramatic. Our app’s conversion rate from store views to installs doubled, increasing by roughly 100% after adopting the AI-generated winner. In practical terms, this meant we unlocked a doubling of our organic growth without spending a cent on additional marketing. For example, if we were getting about 1,000 organic installs per week before, we started seeing around 2,000 installs per week after the change (with the same traffic levels).
The same product, same audience, and same store visibility started delivering twice as many users, purely because the “book cover” finally matched what users were exactly looking for.
Conclusion: Small Changes, Big Wins
Our experiment underscores a powerful lesson for app marketers and product owners: even a small, simple change can yield huge gains. In our case, changing nothing more than the app’s icon led to a 100% increase in conversions.
The new icon clearly resonated better with our target audience. It communicated our app’s value proposition more effectively at a glance, encouraging more people to click and install.
This experiment also highlights the power of AI and A/B testing. GPT-5’s generative ability allowed us to explore new amazing icons, while the app store’s testing tools told us which of them worked best. By combining AI and A/B testing, we tapped into a winning formula. Now, we run similar AI-assisted A/B tests for other aspects of our product’s marketing and UX.
If you want to increase installs without guessing or overspending, we can help you move real metrics.
Churn prediction helps apps spot users who are about to leave – and bring them back with timely, personalized nudges. User churn is one of the biggest threats to sustainability: every abandoned user costs engagement, LTV, referrals, and product learning.
The traditional approach to retention is reactive: companies wait for users to leave, then spend tremendous resources trying to win them back through aggressive campaigns and discounts. This strategy is both expensive and ineffective.
Preventing churn must start early. At DreamBit, we design apps to engage, convert, and retain users, because keeping customers is far more cost-effective than chasing new ones. Let’s explore how our team is transforming user retention through a data-driven, human-centered strategy.
Step 1: The churn prediction framework
What is user churn, and why does it matter?
User churn is simply the percentage of users who stop engaging with your product during a specific time period. To predict churn, you first need to understand user behavior. Dreambit’s approach to retention starts with comprehensive behavioral data collection and analysis. This includes:
| Metrics | Key data points |
| Engagement signals | Session frequency, session duration, active days per week, feature adoption rate |
| Usage patterns | Time since last login, feature frequency, device type, geographic location |
| Interaction depth | In-app purchases, subscription tier, payment history, support tickets opened |
| Feedback & sentiment | App ratings, user reviews, survey responses, NPS scores, support chat sentiment |
This behavioral data is collected passively through app events (clicks, page views, transactions) and analytically through feedback mechanisms. The key is that data collection is continuous, structured, and mapped to business outcomes.
Building the churn prediction model
Once we have clean, organized behavioral data, we build a machine learning model that learns patterns associated with churn. Here’s how it works:
- Feature engineering: We transform raw data into meaningful predictors. For example, instead of raw “days since last login,” create bins like “inactive for 7-14 days” or calculate a “recency decay score” that weights recent inactivity more heavily.
- Class balancing: Churn is typically a rare event (e.g., only 5-10% of users churn in a given month). This imbalance skews models toward predicting “no churn” for everyone. Techniques like SMOTE (Synthetic Minority Oversampling Technique) or weighted loss functions correct this bias.
- Train-test splits: We divide your data chronologically: train on users from months 1-6, validate on month 7, test on month 8. This prevents data leakage and ensures your model generalizes to future data.
- Hyperparameter optimization: Our team uses techniques like Hyperband or grid search to find the best model settings.
A well-tuned churn prediction model typically achieves:
- Precision of 60-70%: Of the users flagged as “at risk,” 60-70% actually churn. This minimizes false alarms and prevents wasteful retention campaigns.
- Recall of 50-60%: The model identifies 50-60% of actual churners before they leave.
- PR AUC (Precision-Recall Area Under Curve) of 0.65-0.75: A metric that balances precision and recall, especially useful when classes are imbalanced.
Defining churn risk segments
Once your model scores users, the next step is to segment them into actionable risk tiers:
| Risk level | Description | Actions required |
| High risk (80-100% churn) | Users showing clear disengagement signals (no activity in 30+ days, negative feedback, downgrades). | Immediate, high-value interventions. |
| Medium risk (50-80%) | Declining engagement, reduced frequency, or missed key milestones. | Re-engagement nudges and value reminders. |
| At-Watch (20-50%) | Early warning signs (not using a key feature, slower adoption, etc.) | Encouragement and education. |
| Stable (0-20%) | Actively engaged, no warning signals. | No intervention needed. |
Step 2: Implementing automated re-engagement workflows
Once you’ve identified at-risk users, the next challenge is engaging them with relevant, timely, non-intrusive messages. Push notifications remain one of the most effective channels for app engagement, but they must be used strategically.
Timing:
- Send notifications when users are most likely to be receptive, typically in the afternoon hours (12 p.m. – 5 p.m.).
- Consider user timezone and local behavior patterns – a fitness app user might respond well to morning motivation, while a e-commerce user might prefer evening shopping time.
- Avoid notification fatigue: Reducing push frequency from daily to once per week decreases unsubscribes by 15%.
Message clarity:
- Keep push notification copy to 10 words or fewer.
- Include clear, action-oriented call-to-action phrases like “Claim Your Offer Now” or “Get 20% Off Today”.
- Emojis can boost open rates by 20% when used appropriately.
Personalization:
- High risk users require messages like “We miss you! 30% off your next purchase – today only.”
- Medium risk customers may need “See what 500K+ users love about [Feature]. Check it out!”
- At-watch users get engaged with simple “Unlock [Benefit] with [Key Feature] in 3 easy steps.”
Note that push notifications should link directly to the specific feature or offer, rather than the app’s homepage. For example, a re-engagement offer should deep-link to the claim page, not require the user to navigate multiple screens. This significantly reduces friction and increases conversion.
Beyond push notifications
While push notifications are powerful, a sophisticated retention strategy should combine multiple channels to reach users where they are.
- Push notifications: Immediate, in-app visibility; highest engagement rate
- In-app messages: Less intrusive than push, can be contextual and personalized
- SMS: High open rates (98%+), effective for time-sensitive offers
- Email: Lower urgency but allows for richer storytelling and multi-step narratives
- Chatbot/Live support: Proactive offer of help for at-risk users (e.g., “Noticed you’re having trouble? Let’s help”)
Step 3: Adopting loyalty programs and long-term retention incentives
In addition to immediate re-engagement offers, our retention strategy includes long-term loyalty programs that reward consistent engagement. These can be:
- Points-based rewards: Every interaction (purchase, review, referral, engagement milestone) earns points redeemable for discounts or exclusive content
- Tier-based status: Bronze → Silver → Gold tiers with escalating perks (discounts, early access, exclusive features, dedicated support)
- Streak rewards: Daily or weekly engagement streaks trigger bonus rewards (common in fitness, education, and productivity apps)
- Exclusive perks: VIP members get early feature access, priority support, or community recognition
- Referral rewards: Users who refer others earn rewards, creating network effects and organic growth
Beyond transactional incentives, retention is fundamentally emotional. Users stay loyal to products that make them feel valued. That’s why we often add personalized greetings, recognition of milestones (“You’ve been with us for 1 year!”), and thoughtful support for our apps.
Typical outcomes from proactive retention programs
After implementing churn prediction and automated re-engagement strategies, organizations typically benefit from the following results.
✅Retention rate improvements: 8-40% increase depending on baseline and program sophistication (fintech and e-commerce see larger gains; B2B SaaS typically 8-15%).
✅Engagement time: 2x-3x increase in daily session duration for users who interact with re-engagement campaigns.
✅Revenue protection: Churn prediction models reduce churn by 10-30%, directly protecting 5-30% of at-risk revenue.
✅Customer lifetime value (LTV): Improved retention multiplies LTV; a 10% retention improvement can increase LTV by 25-50%.
Conclusion: Proactive retention as a strategic advantage
Preventing churn requires prediction and action. By implementing a churn-detection model and coupling it with automated, personalized messaging, you can effectively “plug the leaks” before too many users slip away.
If you’re ready to build a retention engine that keeps your users engaged, reduces churn, and compounds revenue growth, contact us.